
This page applies to Apigee and Apigee hybrid.
View
Apigee Edge documentation.

This playbook can be used to diagnose and resolve 502 Bad Gateway Unexpected EOF errors for both Apigee and Apigee Hybrid.
Symptom
The client application gets an HTTP status code of 502 with the message Bad Gateway as a response for API calls. The HTTP status code 502 means that the client (in this case Apigee) is not receiving a valid response from the backend servers that should actually fulfill the request.
Error messages
Client application API calls encountered the following response code:
HTTP/1.1 502 Bad Gateway
In addition, you may observe the following error message:
{
    "fault": {
        "faultstring": "Unexpected EOF at target",
        "detail": {
            "errorcode":"messaging.adaptors.http.flow.UnexpectedEOFAtTarget",
            "reason":"TARGET_READ_UNEXPECTED_EOF"
          }
      }
}
Common diagnosis steps
To diagnose the error, you can use any of the following methods:
- API Monitoring
- Debug session
- Ingress logs
- Runtime logs
API Monitoring
Diagnose the error using API Monitoring.
In the Google Cloud console, go to the Apigee > Proxy development > API monitoring page.
In the API monitoring page, investigate the 502 errors with the following steps:
- On the Apigee UI of the customer project, go to the Investigate dashboard.
- In the drop down menu labeled Graphs at the top, make sure that at least Fault Code by Status Code and Fault Source by Proxy are selected and ensure that the right time period is selected when the 502 errors occurred.
- Click the box in the matrix when you are seeing a high number of 502 errors.
- On the right side, you can see the details of the 502 errors which would look something like the following:
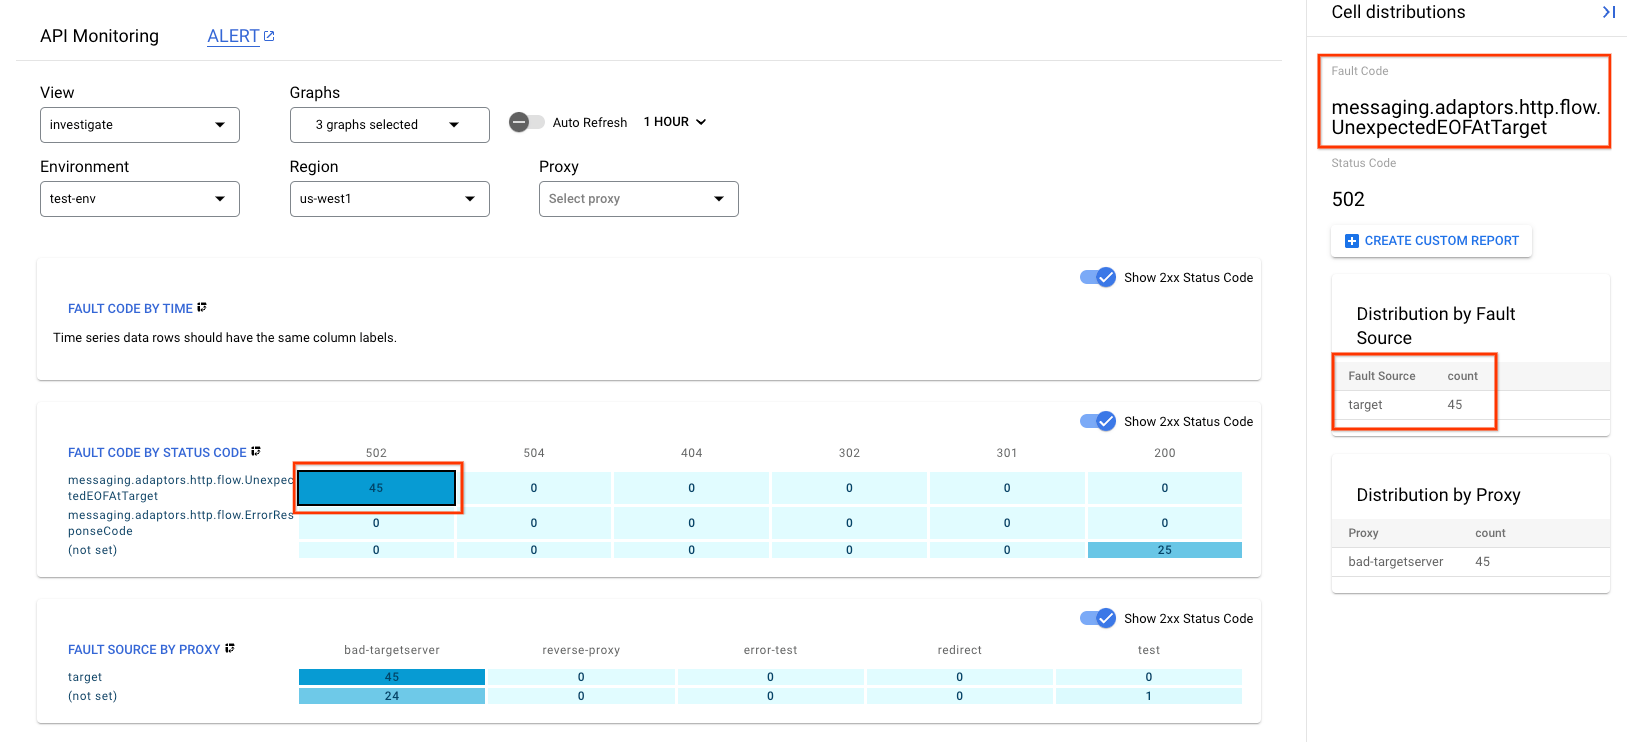
Here you can see the following information:
- Fault Code is
messaging.adaptors.http.flow.UnexpectedEOFAtTarget - Fault Source is
target
This indicates that the 502 error is caused by the target due to unexpected EOF.
Debug session
Diagnose the error using a debug session:
- Run a new debug session while making an API call to reproduce the 502 Bad Gateway error.
- Select one of the failing requests and examine the trace.
- Navigate through the various phases of the trace and locate where the failure occurred.
- You should see the failure after the request has been sent to the target server as shown below (note the screenshot is of debug v1):
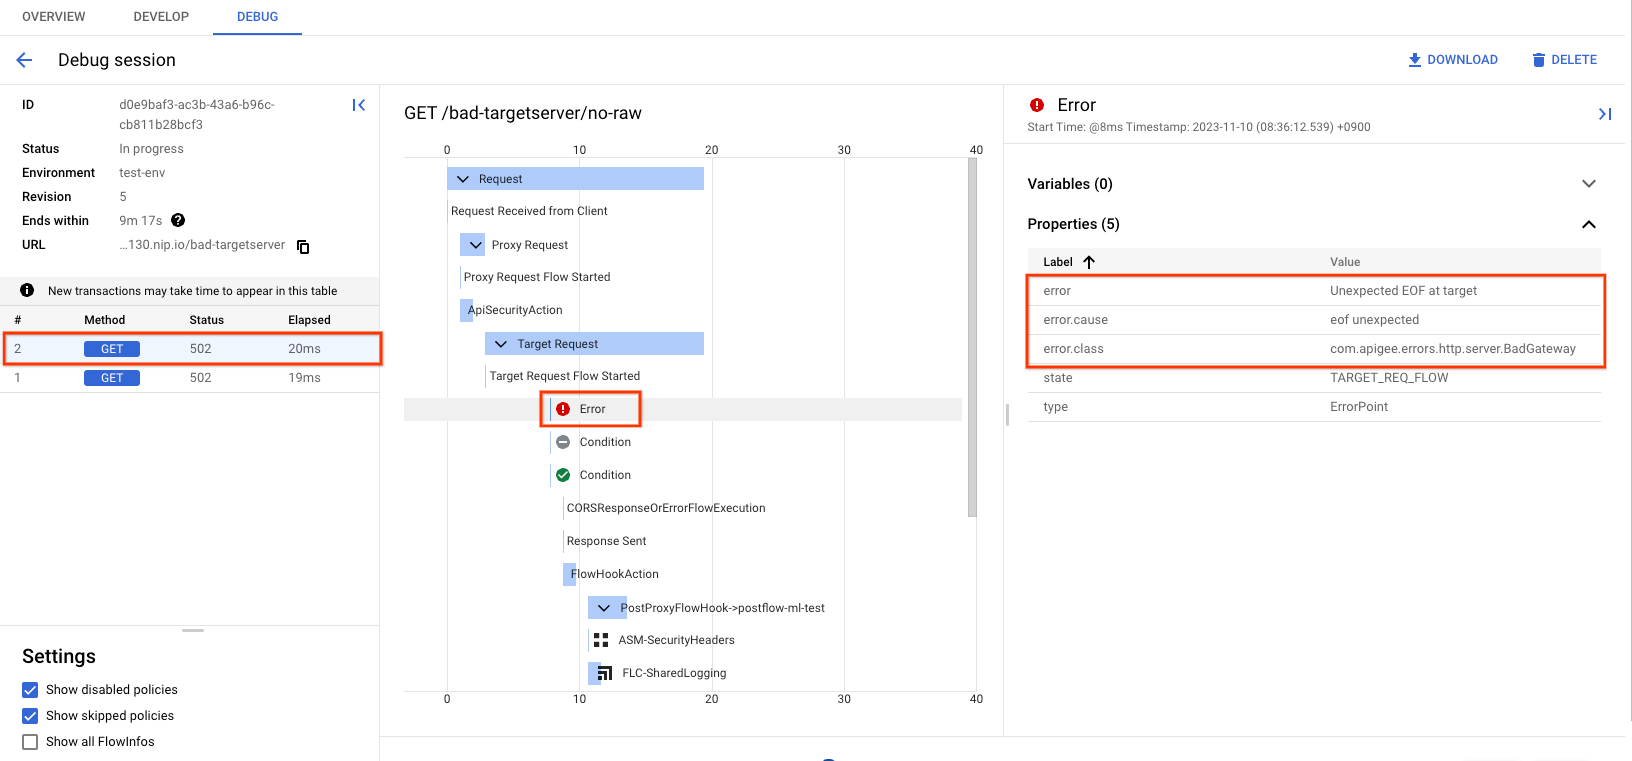
Check the property error at the phase the error occurred as can be seen in the above screenshot. The value should contain the message "Unexpected EOF at target".
You can also determine the value of X-Apigee.fault-source and X-Apigee.fault-code in the AX (Analytics Data Recorded) Phase in the trace. If the values of X-Apigee.fault-source and X-Apigee.fault-code match the values shown in the following table, you can confirm that the 502 error is coming from the target server:
| Response headers | Value |
|---|---|
| fault-source | target |
| fault-code | messaging.adaptors.http.flow.UnexpectedEOFAtTarget |
Istio Ingressgateway logs (Hybrid only)
Another method to diagnose 502 Unexpected EOF at target errors is to check the ingress logs for 502 errors. The ingress logs should show the values of x_apigee_fault_code as messaging.adaptors.http.flow.UnexpectedEOFAtTarget and x_apigee_fault_source as target.
Possible causes
A typical cause for a 502 Bad Gateway error is the Unexpected EOF error which can have the following reasons:
| Cause | Description |
|---|---|
| Incorrectly configured target server | The target server is not properly configured to support TLS/SSL connections in Apigee |
| Backend closes connection abruptly | The backend server may close the connection abruptly, while Apigee is sending data or waiting for a response from the backend server |
| Incorrectly configured keep alive timeout | Keep alive timeouts are configured incorrectly on Apigee and backend server |
| NAT usage with AWS NLB target with cross-zone load balancing and IP preservation | (Apigee X only) NAT usage with AWS NLB target with cross-zone load balancing and IP preservation, |
Cause: Incorrectly configured target server
The target server is not properly configured to support TLS/SSL connections.
Diagnosis
- It is likely that this issue is caused by an incorrect target server configuration if the debug session for the failing API request shows the following:
- The 502 Bad Gateway error is seen as soon as the target flow request starts
- The
error.classdisplaysmessaging.adaptors.http.flow.UnexpectedEOF
{
  "properties": {
    "error.class": "messaging.adaptors.http.flow.UnexpectedEOF",
    "error.cause": "java.io.EOFException: eof unexpected"
  }
}
{ "properties": { "error.class": "messaging.adaptors.http.flow.UnexpectedEOF", "error.cause": "java.io.EOFException: eof unexpected" } } - Get the target server definition using the Apigee management API call
export TOKEN=$(gcloud auth print-access-token);
curl -s -H "Authorization: Bearer $TOKEN" https://apigee.googleapis.com/v1/organizations/{org_name}/environments/{env_name}/targetservers/{target_server}
Sample of a faulty TargetServer definition:
{
  "name": "bad-targetserver",
  "host": "my-apigee-example.sample.appspot.com",
  "port": 443,
  "isEnabled": true,
  "protocol": "HTTP"
}
The illustrated TargetServer definition is an example of a typical misconfiguration which is explained as follows:
Assume that the target server my-apigee-example.sample.appspot.com is configured to accept secure (HTTPS) connections on port 443. However, if you look at the target server definition, there are no other attributes/flags that indicate that it is meant for secure connections. This causes Apigee X to treat the API requests going to the specific target server as HTTP (non-secure) requests. So Apigee X will not initiate the TLS/SSL Handshake process with this target server.
Since the target server is configured to accept only HTTPS (TLS/SSL) requests on port 443, it will reject the request from Apigee X or close the connection. As a result, you get an UnexpectedEOFAtTarget error on the apigee-runtime. The apigee-runtime will send 502 Bad Gateway as a response to the client.
Resolution
Always ensure that the target server is configured correctly as per your requirements. For the illustrated example above, if you want to make requests to a secure (HTTPS TLS/SSL) target server, you need to include the sSLInfo attributes with the enabled flag set to true. While it is allowed to add the sSLInfo attributes for a target server in the target endpoint definition itself, it is recommended to add the SSLInfo attributes as part of the target server definition to avoid any confusion. You can enable all necessary attributes at the target server directly as shown below:
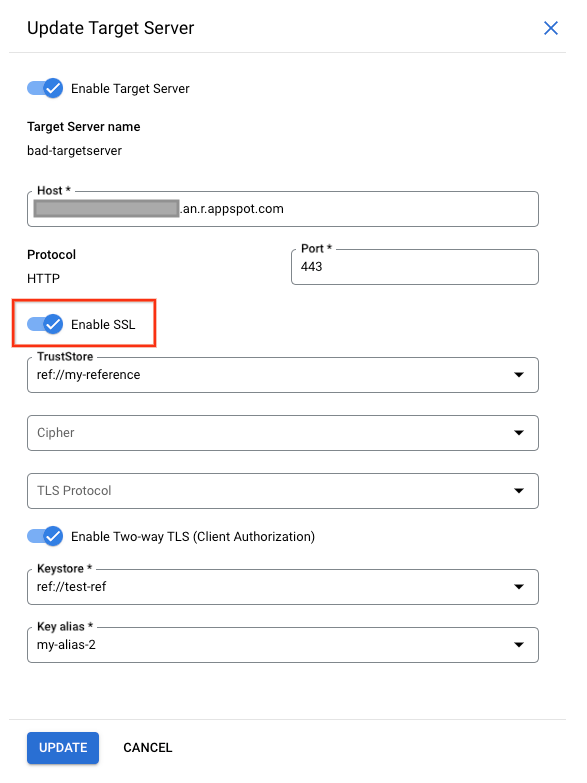
If the backend service requires one-way SSL communication, then you need to enable the TLS/SSL in the target server definition by including the sSLInfo attributes where the enabled flag is set to true. The API call to get the target server should return data as shown below:
{
    "name": "bad-targetserver",
    "host": "my-apigee-example.sample.appspot.com",
    "port": 443,
    "isEnabled": true,
    "sSLInfo": {
        "enabled": true
    },
    "protocol": "HTTP"
}
If the target server's certificate needs to be validated in Apigee X, then the truststore containing the target server's certificate needs to be included as well as shown below:
{
    "name": "bad-targetserver",
    "host": "my-apigee-example.sample.appspot.com",
    "port": 443,
    "isEnabled": true,
    "sSLInfo": {
        "enabled": true,
        "trustStore": "ref://my-reference"
    },
    "protocol": "HTTP"
}
If the backend service requires two-way SSL communication, then you need to have sSLInfo attributes with clientAuthEnabled, keystore, keyAlias and truststore flags set appropriately, as shown below:
{
    "name": "bad-targetserver",
    "host": "my-apigee-example.sample.appspot.com",
    "port": 443,
    "isEnabled": true,
    "sSLInfo": {
        "enabled": true,
        "clientAuthEnabled": true,
        "keyStore": "ref://test-ref",
        "keyAlias": "my-alias-2",
        "trustStore": "ref://my-reference"
    },
    "protocol": "HTTP"
}
Cause: Backend closes connection abruptly
After establishing a TCP connection, the backend server may abruptly close this connection while Apigee is sending data or waiting for a response which triggers an EOF exception on Apigee Runtime.
Diagnosis
Use API Monitoring, Debug sessions or Ingress logs as demonstrated in the Common diagnosis steps to determine the message ID, fault code, and fault source for the 502 error.
The following log is an example of an Istio Gateway log (Hybrid only) created when the backend closes the connection abruptly (the example is shortened a bit). Note especially the x_apigee_fault_code showing the exception UnexpectedEOFAtTarget, the x_apigee_fault_source which is the target and the status containing the HTTP 502 status code:
{
    "dynamic_data": {
      "x_apigee_fault_flag": "false",
      "x_apigee_target_latency": "3335",
      "x_apigee_dp_color": "1-11-0-apigee-8",
      "x_apigee_fault_revision": "/organizations/test-org/environments/test-env/apiproxies/eof-test/revisions/5",
      "x_apigee_fault_code": "messaging.adaptors.http.flow.UnexpectedEOFAtTarget",
      "x_apigee_tracking_id": "b65eb01ec690656918d39cc767eb6aad",
      "x_apigee_organization": "test-org",
      "x_apigee_fault_source": "target",
      "x_apigee_message_id": "123abc45-6def-789a-bc1-23def456abc78",
      "x_envoy_upstream_service_time": "3558",
      "x_apigee_region": "us-east1",
      "x_apigee_fault_policy": "null/null",
      "x_apigee_environment": "test-env",
      "x_apigee_proxy": "/organizations/test-org/environments/test-env/apiproxies/eof-test/revisions/5",
      "x_apigee_proxy_basepath": "/eof-test"
    },
    "start_time": "2023-12-13T07:08:03.054Z",
    "request_time": 3562,
    "host": "203.0.113.10.nip.io",
    "request_method": "GET",
    "apigee_tracking_id": "b65eb01ec690656918d39cc767eb6aad",
    "upstream_address": "10.1.1.2:8443",
    "status": 502,
    "upstream_response_time": 3560,
    "x_forwarded_for": "198.51.100.10,203.0.113.10,198.51.100.11",
    "request_protocol": "HTTP/1.1",
    "status_details": "via_upstream",
    "remote_address": "192.0.2.10:45752",
    "tls_protocol": "TLSv1.2",
    "request_id": "ce871b05-e62d-44a9-b15d-cb2f3553fd7f",
    "bytes_received": 0,
    "upstream_response_flags": "-"
}
Take note of the x_apigee_message_id in the Istio Gateway log( Hybrid only ) (or get the message_id from another source i.e. the debug-session) and check the apigee-runtime logs( Hybrid only ) for the 502 Istio log.
The following sample log shows the java.io.EOFException:
{
  "insertId": "2xo6ibes68n88g38",
  "jsonPayload": {
    "level": "SEVERE",
    "logger": "HTTP.CLIENT",
    "className": "com.apigee.protocol.http.HTTPClient$Context$3",
    "message": "ClientChannel[Connected: Remote:203.0.113.20:8080 Local:10.1.1.2:25480]@148915 useCount=0 bytesRead=0 bytesWritten=1303 age=3334ms lastIO=3163ms isOpen=true.onExceptionRead",
…
    "thread": "NIOThread@0",
    "exceptionStackTrace": "java.io.EOFException: eof unexpected\n\tat com.apigee.nio.channels.PatternInputChannel.doRead(PatternInputChannel.java:31)\n\tat com.apigee.nio.channels.InputChannel.read(InputChannel.java:95)\n\tat com.apigee.protocol.http.io.MessageReader.onRead(MessageReader.java:87)\n\tat com.apigee.nio.channels.DefaultNIOSupport$DefaultIOChannelHandler.onIO(DefaultNIOSupport.java:44)\n\tat com.apigee.nio.handlers.NIOThread.run(NIOThread.java:195)\n",
    "method": "onException"
  },
…
}
In the above example, you can see that the java.io.EOFException: eof unexpected error occurred while the apigee-runtime is trying to read a response from the backend server. This exception indicates the end of file (EOF), or the end of stream has been reached unexpectedly.
This means the apigee-runtime connected successfully to the backend server and either was sending the API request or it was waiting for or reading the response from the backend. However, the backend server terminated the connection abruptly due to some reason before the apigee-runtime got the expected response or could read the complete response.
To get the final proof that the backend server terminated the connection abruptly, you can do the following:
- Typically, this error is caused because the backend server responds back with
[FIN,ACK]as soon as the apigee-runtime sends the request to the backend server. Check the backend server logs and see if there are any errors or information that could have led the backend server to terminate the connection abruptly. If you find any errors/information, then go to Resolution and fix the issue appropriately in your backend server. If you don't find any errors or information in your backend server, collect the packet capture on the first hop right after Apigee. - (Hybrid only) You might also want to collect the packet capture on the apigee-runtime by following the community article on How to take a tcpdump. For GKE only, you could follow https://cloud.google.com/container-optimized-os/docs/how-to/toolbox.
- Consider the following tcpdump example. This is a sample tcpdump taken when 502 Bad Gateway Error UnexpectedEOFAtTarget occurred:

Sample tcpdump where the backend sends a FIN, ACK prematurely. - From the TCPDump output, you notice the following sequence of events:
- Packets 2354 to 2372 successfully establish the connection between the apigee-runtime and the backend server.
- In packet 2512, the backend server responds back with [FIN,ACK] (the 3 seconds of elapsed time between packet 2372 from Apigee and the [FIN, ACK] of packet 2512 from the backend occur because this example is constructed by letting the backend sleep 3 seconds after which it closes the connection).
- In packet 2516, the apigee-runtime responds with [FIN,ACK] to the backend server.
- Eventually the connections are closed with a [RST] from Apigee.
- Because Apigee is either still sending its request or waiting for / reading the response from the backend server, the sudden [FIN,ACK] from the backend server is not expected by Apigee, which lets the apigee-runtime throw the exception
java.io.EOFException: eof unexpected.
Resolution
Important to note here is that this is not a typical Connection Timeout error (status code 503) because the TCP connection got successfully established, and also no Service Unavailable error (status code 504) because the connection was successfully closed via a [FIN, ACK] from the backend (although the apigee-runtime did not expect a [FIN, ACK] at this time). This can happen if there is a network issue at the backend server or some error in the code of the backend. The customer needs to engage their network operations team and backend server team to investigate this issue further and fix the issue on the backend server or network hop appropriately.
Cause: Incorrectly configured keep alive timeout
Before you diagnose if this is the cause for the 502 errors, please read through the following concepts.
Persistent connections in Apigee
Apigee X by default follows the HTTP/1.1 standard and uses persistent connections when communicating with the target backend server. Persistent connections can increase performance by allowing an already established TCP and (if applicable) TLS/SSL connection to be re-used, which reduces latency overheads. The duration for which a connection needs to be persisted is controlled through the keep alive timeout property (in Apigee's target endpoint config, this property is called keepalive.timeout.millis).
Both the backend server and the Apigee apigee-runtime use keep alive timeouts to keep connections open with one another. Once no data is received within the keep alive timeout duration, the backend server or apigee-runtime can close the connection with the other.
API Proxies deployed to an apigee-runtime in Apigee X, by default, have a keep alive timeout set to 60 seconds unless overridden. Once no data is received for 60s, Apigee will close the connection with the backend server. The backend server will also maintain a keep alive timeout, and once this expires the backend server will close the connection with the apigee-runtime.
Implication of incorrect keepalive timeout configuration
If either Apigee or the backend server is configured with incorrect keep alive timeouts, then it results in a race condition which causes the backend server to send an unexpected End Of File (FIN) in response to a request for a resource.
For example, if the keep alive timeout is configured within the API Proxy or the apigee-runtime with a value greater than or equal to the timeout of the upstream backend server, then the following race condition can occur. That is, if the apigee-runtime does not receive any data until very close to the threshold of the backend server keep alive timeout, but a request comes through and is sent to the backend server using the existing connection, it can lead to 502 Bad Gateway due to Unexpected EOF error as explained below:
- Assume the keep alive timeout set on both the apigee-runtime and the backend server is 60 seconds and no new request came until 59 seconds after the previous request was served by the specific apigee-runtime.
- The apigee-runtime goes ahead and processes the request that came in at the 59th second using the existing connection (as the keep alive timeout has not yet elapsed) and sends the request to the backend server.
- However, before the request arrives at the backend server the keep alive timeout threshold has since been exceeded on the backend server.
- The apigee-runtime 's request for a resource is in-flight, but the backend server attempts to close the connection by sending a FIN packet to the apigee-runtime.
- While the apigee-runtime is waiting for the data to be received, it instead receives the unexpected FIN, and the connection is terminated.
- This results in an Unexpected EOF and subsequently a 502 error is returned to the client by the apigee-runtime.
In this case, we observed the 502 error occurred because the same keep alive timeout value of 60 seconds was configured on both the apigee-runtime and backend server. Similarly, this issue can also happen if a higher value is configured for keep alive timeout on the apigee-runtime than on the backend server.
Diagnosis
Use API Monitoring, Debug sessions or Ingress logs as demonstrated in the Common diagnosis steps to determine the message ID, fault code, and fault source for the 502 error.
The following log is an example of an Istio Gateway log (Hybrid only) created when the backend closes the connection abruptly (the example is shortened a bit). Note especially the x_apigee_fault_code showing the exception UnexpectedEOFAtTarget, the x_apigee_fault_source which is the target and the status containing the HTTP 502 status code:
{
...
"dynamic_data": {
"x_apigee_fault_flag": "false",
"x_apigee_target_latency": "3335",
"x_apigee_dp_color": "1-11-0-apigee-8",
"x_apigee_fault_revision": "/organizations/my-org/environments/test-env/apiproxies/eof-test/revisions/5",
"x_apigee_fault_code": "messaging.adaptors.http.flow.UnexpectedEOFAtTarget",
"x_apigee_tracking_id": "b65eb01ec690656918d39cc767eb6aad",
"x_apigee_organization": "my-org",
"x_apigee_fault_source": "target",
"x_apigee_message_id": "951a6d91-1c83-4cd0-bd0d-5d69d0310b1e1",
"x_envoy_upstream_service_time": "3558",
"x_apigee_region": "us-east1",
"x_apigee_fault_policy": "null/null",
"x_apigee_environment": "test-env",
"x_apigee_proxy": "/organizations/my-org/environments/test-env/apiproxies/eof-test/revisions/5",
"x_apigee_proxy_basepath": "/eof-test"
},
"start_time": "2023-12-13T07:08:03.054Z",
"request_time": 3562,
"host": "203.0.113.10.nip.io",
"request_method": "GET",
"apigee_tracking_id": "b65eb01ec690656918d39cc767eb6aad",
"upstream_address": "10.1.1.2:8443",
"status": 502,
"upstream_response_time": 3560,
"x_forwarded_for": "198.51.100.10,203.0.113.10,198.51.100.11",
"request_protocol": "HTTP/1.1",
"status_details": "via_upstream",
"remote_address": "192.0.2.10:45752",
"tls_protocol": "TLSv1.2",
"request_id": "ce871b05-e62d-44a9-b15d-cb2f3553fd7f",
"bytes_received": 0,
"upstream_response_flags": "-"
},
"resource": {
...
}
},
"timestamp": "2023-12-13T07:08:06.867811686Z",
"severity": "INFO",
"labels": {
..
},
...
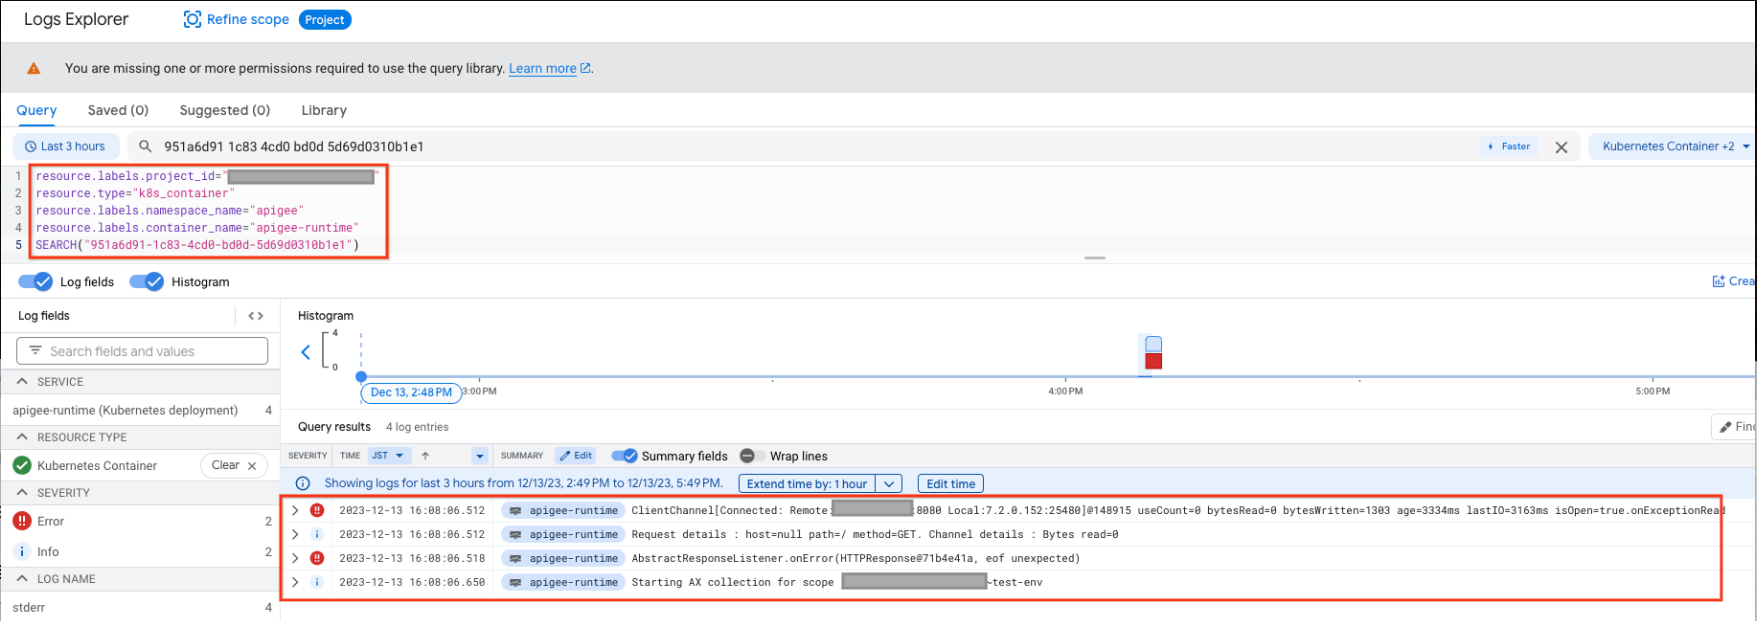
}Take note of the x_apigee_message_id in the Istio Gateway log( Hybrid only ) (or get the message_id from another source i.e. the debug-session) and check the apigee-runtime logs( Hybrid only ) for the 502 Istio log. You can match Istio logs with apigee-runtime logs. The query to Apigee Runtime will show logs similar to the following:
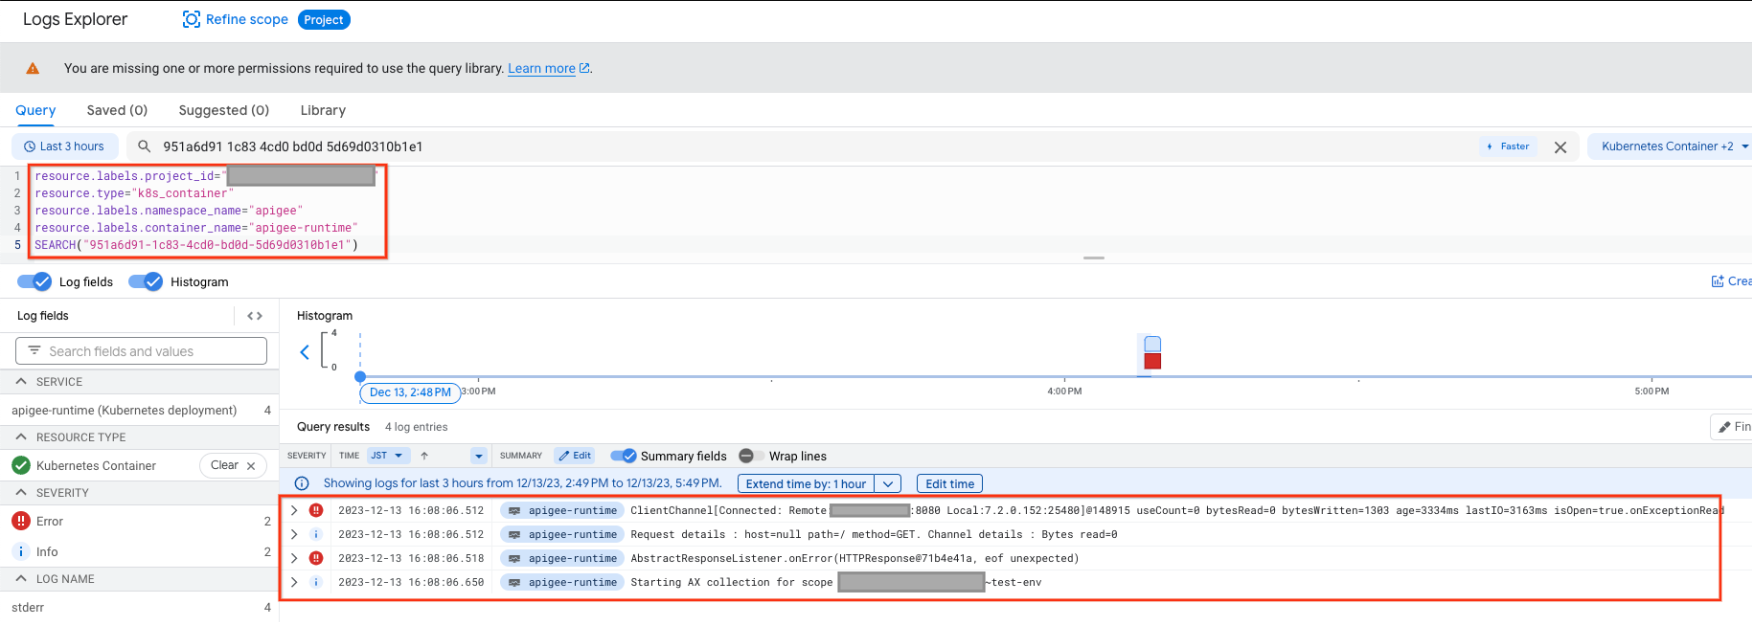
The following log sample log shows the java.io.EOFException
{
  "insertId": "2xo6ibes68n88g38",
  "jsonPayload": {
    "level": "SEVERE",
    "logger": "HTTP.CLIENT",
    "className": "com.apigee.protocol.http.HTTPClient$Context$3",
    "message": "ClientChannel[Connected: Remote:203.0.113.20:8080 Local:10.1.1.2:25480]@148915 useCount=7 bytesRead=0 bytesWritten=1303 age=3334ms lastIO=3163ms isOpen=true.onExceptionRead",
…
    "thread": "NIOThread@0",
    "exceptionStackTrace": "java.io.EOFException: eof unexpected\n\tat com.apigee.nio.channels.PatternInputChannel.doRead(PatternInputChannel.java:31)\n\tat com.apigee.nio.channels.InputChannel.read(InputChannel.java:95)\n\tat com.apigee.protocol.http.io.MessageReader.onRead(MessageReader.java:87)\n\tat com.apigee.nio.channels.DefaultNIOSupport$DefaultIOChannelHandler.onIO(DefaultNIOSupport.java:44)\n\tat com.apigee.nio.handlers.NIOThread.run(NIOThread.java:195)\n",
    "method": "onException"
  },
…
}

}
The error java.io.EOFException: eof unexpected indicates that the apigee-runtime received an EOF while it was still waiting to read a response from the backend server.
The attribute useCount=7 in the error message indicates that the apigee-runtime had re-used this connection about seven times and the attribute bytesWritten=1303 indicates that the apigee-runtime had sent the request payload of 1303 bytes to the backend server. However it received zero bytes back when the unexpected EOF error occurred.
This shows that the apigee-runtime had re-used the same connection multiple times, and on this occasion it sent data but shortly afterwards received an EOF before any data was received. This means there is a high probability that the backend server's keep alive timeout is shorter or equal to that set in the API proxy.
You can investigate further with the help of tcpdump as explained below.
- If you don't find any errors or information in your backend server, collect the packet capture on the first hop right after Apigee with the following command:
tcpdump -i any -s 0 host <BACKEND_HOSTNAME> -w <FILENAME>
- (Hybrid only) You might also want to collect the packet capture on the apigee-runtime by following the community article on How to take a tcpdump. For GKE only, you could follow https://cloud.google.com/container-optimized-os/docs/how-to/toolbox.
- Analyze the tcpdump captured:
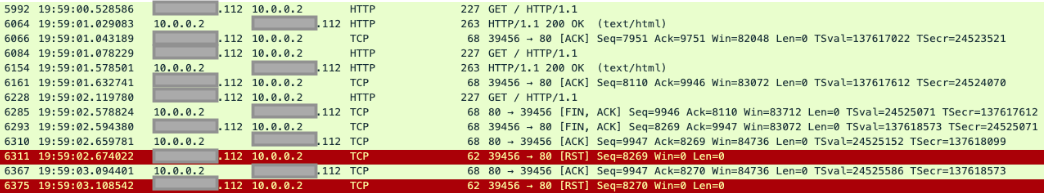
In the above sample tcpdump, you can see the following:
- In packet 5992, the backend server received a GET request.
- In packet 6064, it responds with 200 OK.
- In packet 6084, the backend server received another GET request.
- In packet 6154, it responds with 200 OK.
- In packet 6228, the backend server received a third GET request.
- This time, the backend server returns a FIN, ACK to the apigee-runtime (packet 6285) initiating the closure of the connection.
The same connection was re-used twice successfully in this example, but on the third request, the backend server initiates a closure of the connection, while the apigee-runtime is waiting for the data from the backend server. This suggests that the backend server's keep alive timeout is most likely shorter or equal to the value set in the API proxy.
Compare keep alive timeout on Apigee and backend server
- By default, Apigee X uses a value of 60 seconds for the keep alive timeout property.
- However, it is possible that the customer may have overridden the default value in the API Proxy. You can verify this by checking the specific TargetEndpoint definition in the failing API Proxy that is giving 502 errors. This is a sample TargetEndpoint configuration where the keep alive timeout property is overridden with a value of 30 seconds (30000 milliseconds):
- Next, check the keep alive timeout property configured on your backend server. Assume that your backend server is configured with a value of 25 seconds.
- If you determine that the value of the keep alive timeout property on Apigee is higher than the value of the keep alive timeout property on the backend server as in the above example, then that is the cause for 502 errors.
<TargetEndpoint name="default">
 <HTTPTargetConnection>
    <URL>https://mocktarget.apigee.net/json</URL>
    <Properties>
      <Property name="keepalive.timeout.millis">30000</Property>
    </Properties>
  </HTTPTargetConnection>
</TargetEndpoint>Resolution
Ensure that the keep alive timeout property is always lower on Apigee (in the API Proxy and apigee-runtime component) compared to that on the backend server.
- Determine the value set for the keep alive timeout on the backend server.
- Configure an appropriate value for the keep alive timeout property in the API Proxy or apigee-runtime, such that the keep alive timeout property is lower than the value set on the backend server, using the steps described in Antipattern: Disable HTTP persistent (reusable keep-alive) connections.
Cause: NAT usage with AWS NLB target with cross-zone load balancing and IP preservation
(Apigee X only) If you are using AWS NLB as a target, you might encounter the following issue:
Suppose AWS NLB has 3 IPS:
203.0.113.1:443 (AZ 1)
203.0.113.2:443 (AZ 2)
203.0.113.3:443 (AZ 3)
Apigee X establishes following connection:
- 192.0.2.10:30009 -> 203.0.113.1:443
- 192.0.2.10:30009 -> 203.0.113.1:443 (existing)
- 192.0.2.10:30009 -> 203.0.113.2:443 (new)
This is a valid behavior.
The problem occurs if 203.0.113.1:443 and 203.0.113.2:443 point to the same NLB backend. If so, the backend will receive packets belonging to two different connections but arriving from the same source. Which will break both connections.
First connection might fail with the same EOF error, although other errors are possible.
Diagnosis
Verify if all conditions below are true:
- NAT IPs are provisioned
- Target is AWS NLB
- Cross-zone load balancing is enabled.
- Client IP preservation is enabled.
If so, the issue should intermittently occur. Since issues can be diagnosed by the conditions above, .pcap is not necessary. However, it is possible to spot it on the target networking capture, but not the Apigee capture.
Target .pcap diagnosis
To spot it on the target capture in Wireshark:
- Filter by the port of the affected connection: e.g. tcp.port == 30009
- Right click on Column -> Column Preferences. Add Column of Type: Custom. Field: tcp.seq_raw. This will display raw sequence numbers.
- Look for any new sequence numbers for packets with Apigee source IP. For example, if you see a raw sequence number starting with 384... and suddenly it switches to 376... without a valid use-case for a port reuse, it is a conflicting connection.
Resolution
Disable Cross-zone load balancing or Client IP preservation.
Cloud NAT behaves correctly here, and this is an issue with NLB architecture. No changes can be made at Apigee.
Must gather diagnostic information
If the problem persists even after following the above instructions, gather the following diagnostic information, and then contact Google Cloud Customer Care
- Google Cloud project ID
- Apigee organization
- API proxy and revision
- A downloaded debug session file for a failing API call.
- Backend server logs corresponding to the time of the failures.
- A
tcpdumppacket capture from the Message Processor or the backend server during the failure.