

The Totals feature in an Explore works by totaling the distinct underlying data. This means that Totals might return a value that is different from what you were expecting if you were viewing just the visible data in the Explore data table or visualization. Keep reading for more details and solutions for calculating the total you need.
Why totals can be lower
To calculate totals, Looker generates a SQL query that omits from the SELECT and GROUP BY statements any unpivoted dimensions that were selected in the Explore before it runs the query against the database.
For example, suppose you want to count the number of distinct users who bought a certain category of product over a period of time. You can create an Explore query with Users Count grouped by Products Category:
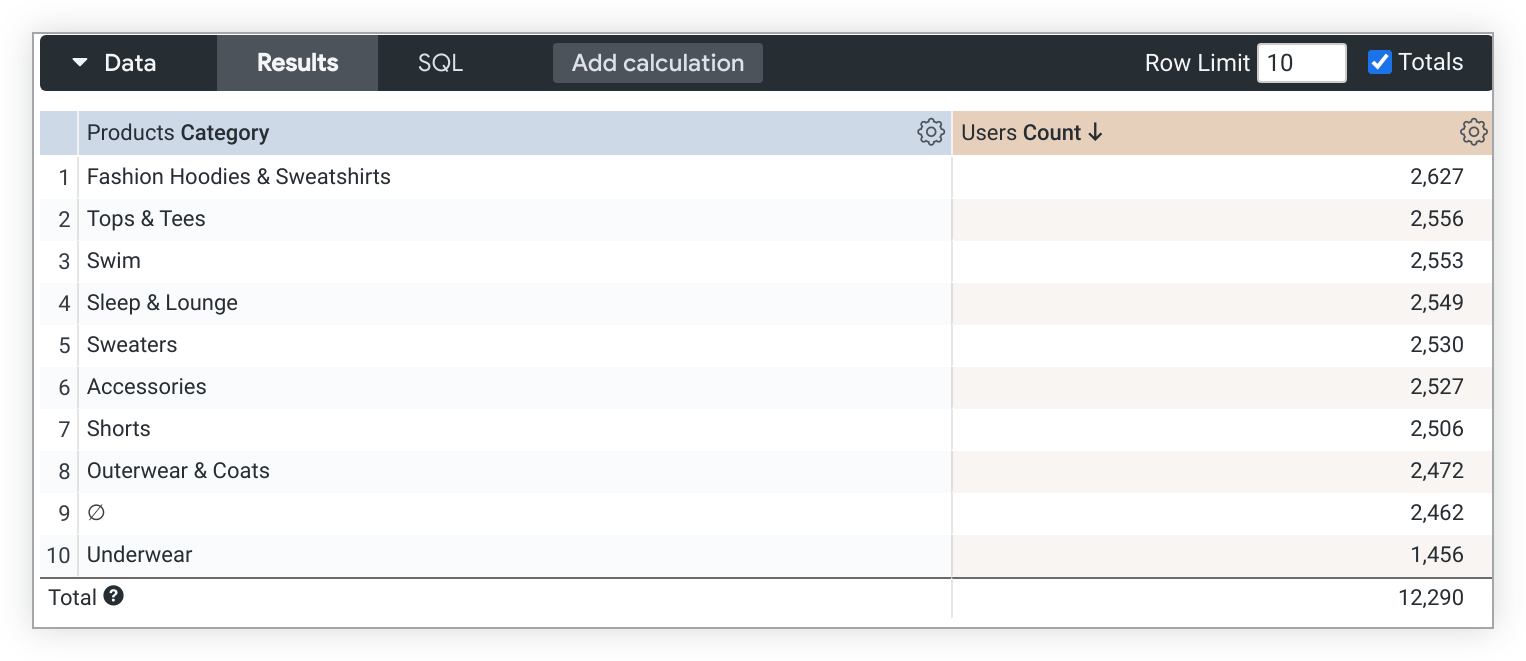
The SQL used to create this table looks like this:
  SELECT
  products.category AS 'products.category',
  COUNT(DISTINCT users.id ) AS 'users.count'
With the Totals option enabled, the total users is 12,290.
Notice that if you manually add the values in the Users Count column, you get a number that is much higher than the total that is reported by Looker. Because each user can make purchases from multiple categories of products, when you add up each row yourself, you add some users more than once. However, Looker uses a SQL query to calculate the count of distinct users and in this way avoids double-counting.
The SQL that Looker uses to calculate the total looks like this:
  SELECT
  COUNT(DISTINCT users.id ) AS 'users.count'
Notice that Looker uses the users.count measure to calculate the total, and omits products.category, an unpivoted dimension, from the SELECT and GROUP BY statements in the SQL query.
Any filters and joins will also be included in the totals query, which will keep the total consistent as the query changes.
Because unpivoted dimensions are omitted from the totals query, Liquid
variables that depend on the presence of a dimension in the query, such as
_in_query and _is_selected, evaluate to
false in the SQL query that Looker runs to
calculate totals.
Why totals can be higher or null
Looker totals can be different from the totals that you get by
adding up the row values. Specifically, your totals can appear higher or can even appear
as null in the following situations:
-
When the query is filtered by a measure:
Looker calculates totals before the measure filter's
HAVINGclause is applied to the individual rows of the Explore.- If the overall aggregate value for the entire dataset satisfies the measure filter, the total is displayed. Because this total is calculated before the filter removes rows from the main Explore data table, the total can be higher than the sum of the displayed rows.
-
If the overall aggregate value for the entire dataset doesn't satisfy
the measure filter, the filter condition evaluates to
falsefor the totals query. Because the totals query returns no results, the total is displayed asnull.
- When the query is hitting the row limit: The total query that Looker creates isn't subject to those limits, because the total is only ever going to return a single row.
Why row totals can be different
The Why totals can be lower section on this page explains that Looker generates a SQL query without including the unpivoted dimensions that may be selected in an Explore before it runs the query against the database.
For row
totals, Looker behaves similarly, but instead of
removing unpivoted dimensions, it removes pivoted dimensions from the
SELECT and GROUP BY statements in the SQL query
that it runs to calculate the totals.
How to calculate value totals
To calculate totals on just the values in the table, you can create a new column using table calculations. See the following examples for details.
Calculating a column total
To calculate a total of column values, you can use the sum function in a table calculation:
sum(${view_name.field_name})
Alternatively, you can use the Running column total shortcut calculation when you have the permissions to create table calculations.
Calculating a row total
To calculate a total of row values, you can use the sum and pivot_row() functions in a table calculation:
sum(pivot_row(${view_name.field_name}))
Note: This approach will generate a new column and won't appear as a standard "Total" row or column.
Alternatively, you can use the Running row total shortcut calculation when you have the permissions to create table calculations.
Additional resources
Some table calculations that perform aggregations, such as calculations that use percentile or median, might also not add up as you expect. This is because table calculations calculate totals by using the values in the Total row, not by using the values in the data column. See the Display potentially confusing table calculation totals as Null Best Practices page for troubleshooting tips.