

In Cloud Billing cost reports, when you open the report from an existing budget, the report's filters are configured based on the scope of the budget, and you can view the budget's amount in your report. The budget's target amount appears in the report chart as a red, dashed, horizontal line, helping you to visualize the budget while you're analyzing the specific costs that are tracked by the budget.
You have these options to view a budget amount in a report:
- View the cost report for the current month, with report filters matching your budget scope.
- View the cost report for the previous 12 months, with report filters matching your budget scope.
| View a budget in your cost report showing costs for the current month | |
|---|---|
To view a budget in your cost report for the current month, take the following steps:
|
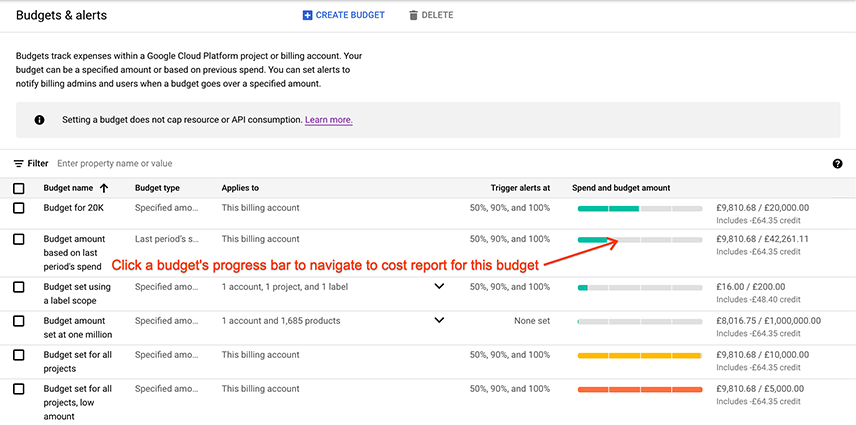
|
The cost report opens with the following settings:
|
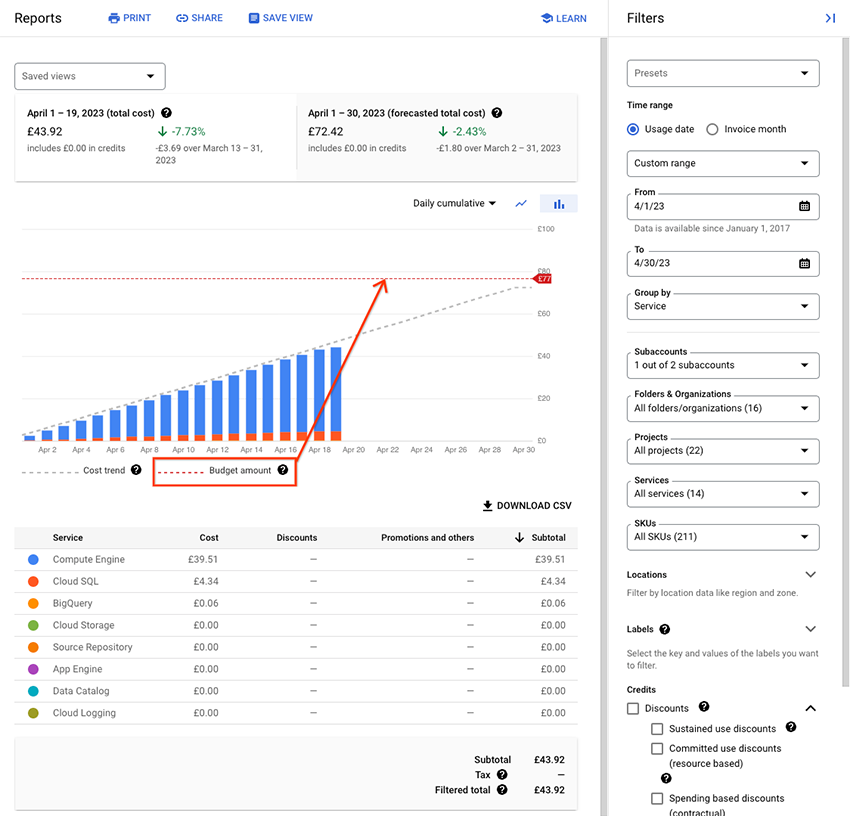
|
| View a budget in your cost report showing costs for the previous 12 months | |
|---|---|
To view a budget in your cost report for the previous 12 months, take the following steps:
|
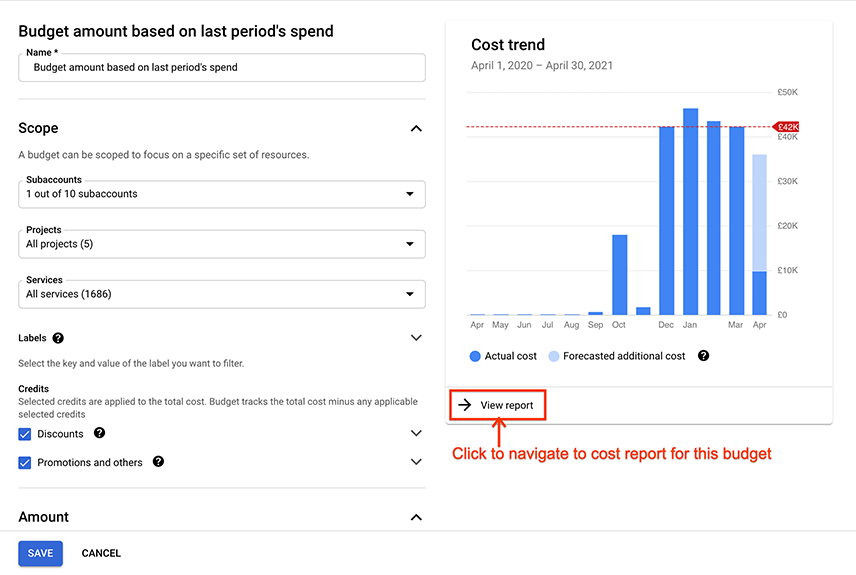
|
The cost report opens with the following settings:
|
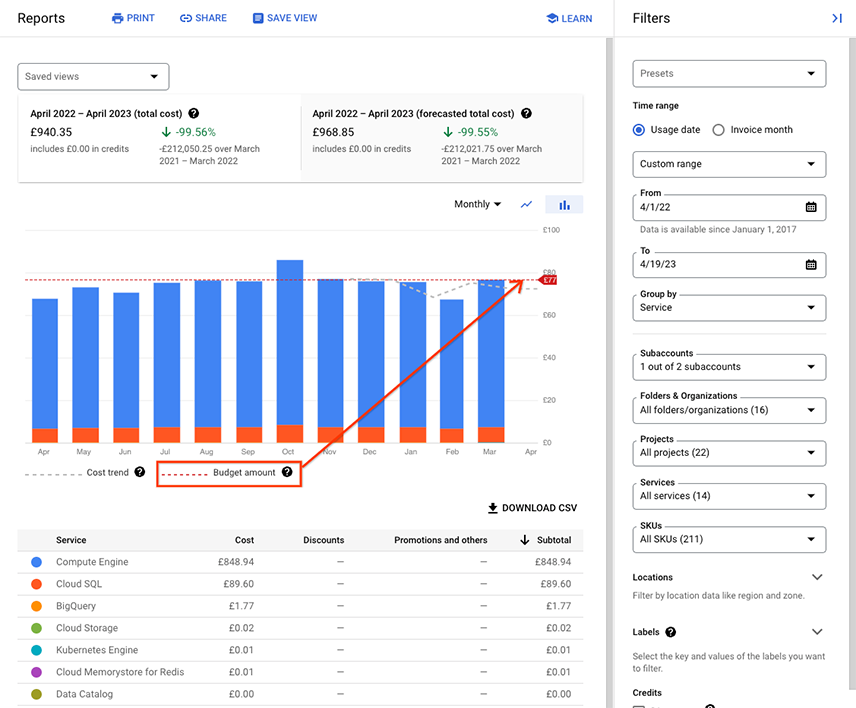
|
Analyze the report when the budget amount line is visible
The budget amount line is removed from the report if you adjust most of the report settings. However, you can adjust the following settings in the report and the budget amount line will remain visible.
- Group by setting: You can switch the Group by setting to use any of the available options.
- Chart style setting: You can switch the Chart style setting between bar chart and line chart.
- Savings setting: You can select or clear the Savings filters to change the view of your cost calculations to include or exclude credits, helping you see how credits impact the cost calculations compared to your budget target amount.
If you change any other report settings, the budget amount line is removed. These settings include the report's time range settings, the report chart time aggregation settings, and the report filters, including Subaccounts, Projects, Services, SKUs, Locations, and Labels.
To restore the budget amount line, re-open the report from a budget.
Understand the differences between budget scopes and report filters
Budget scopes and report filters behave slightly differently. In each of the scopes in a budget, you can select from a list of all possible items available in a given scope. In each of the report filters, you can select from a list of items that incurred usage costs in the Cloud Billing account you're viewing. This means that the items selectable in your budget scopes might not match up exactly to the items selectable in your cost report filters.
Review the following examples for more information:
Projects: budget scope versus cost report filter
For the Cloud Billing account, assume the following regarding projects:
- 20 active projects incurring costs.
- 10 inactive projects that previously incurred costs.
- This Cloud Billing account is also incurring charges that aren't specific to a project, such as the cost of a support plan.
- You have billing-account-level permissions to access the Cloud Billing account.
| Budget | Cost Report |
|---|---|
| On your budget, in your Projects scope, you can select from the 20 active projects. You can't select inactive projects or select [Charges not specific to a project]. | On the cost report, your Projects filter list includes all projects for which you have incurred usage costs, both active projects and inactive projects. Your Projects filter also includes the option to select and view [Charges not specific to a project]. |
| On your budget, you set the Project scope to "All projects (20)" — where "20" indicates 20 active projects. | When you open the cost report from the budget, the value in the report's Projects filter displays "All projects (31)" — where "31" indicates that you have 31 projects that have incurred costs in the Cloud Billing account you're viewing, including active and inactive projects, and [Charges not specific to a project]. |
| When you open the cost report from the budget's cost trend chart, if your budget scope is set for all projects, and your Cloud Billing account is incurring charges not specific to a project, you might notice that your costs appear higher in the cost report than in the budget's cost trend chart. | |
Services: budget scope versus cost report filter
For the Cloud Billing account, assume the following regarding services:
- There are 200 possible services or products that you could use.
- The Cloud Billing account has incurred costs for 16 out of the 200 possible services.
| Budget | Cost Report |
|---|---|
| On your budget, in your Services scope, you can see and select from all 200 possible services, even if you haven't incurred any usage or costs for those services. | On the cost report, your Services filter list includes only those services or products for which you have incurred usage costs. |
| On your budget, you set the Services scope to "All services (200)" — where "200" indicates all possible services. | When you open the cost report from the budget, the value in the report's Services filter displays "All services (16)" — where "16" indicates that you only have 16 services that have incurred costs in your Cloud Billing account. |